Why Does USDT APY Change? What Makes Yield Rise, Fall, or Vanish
Contents
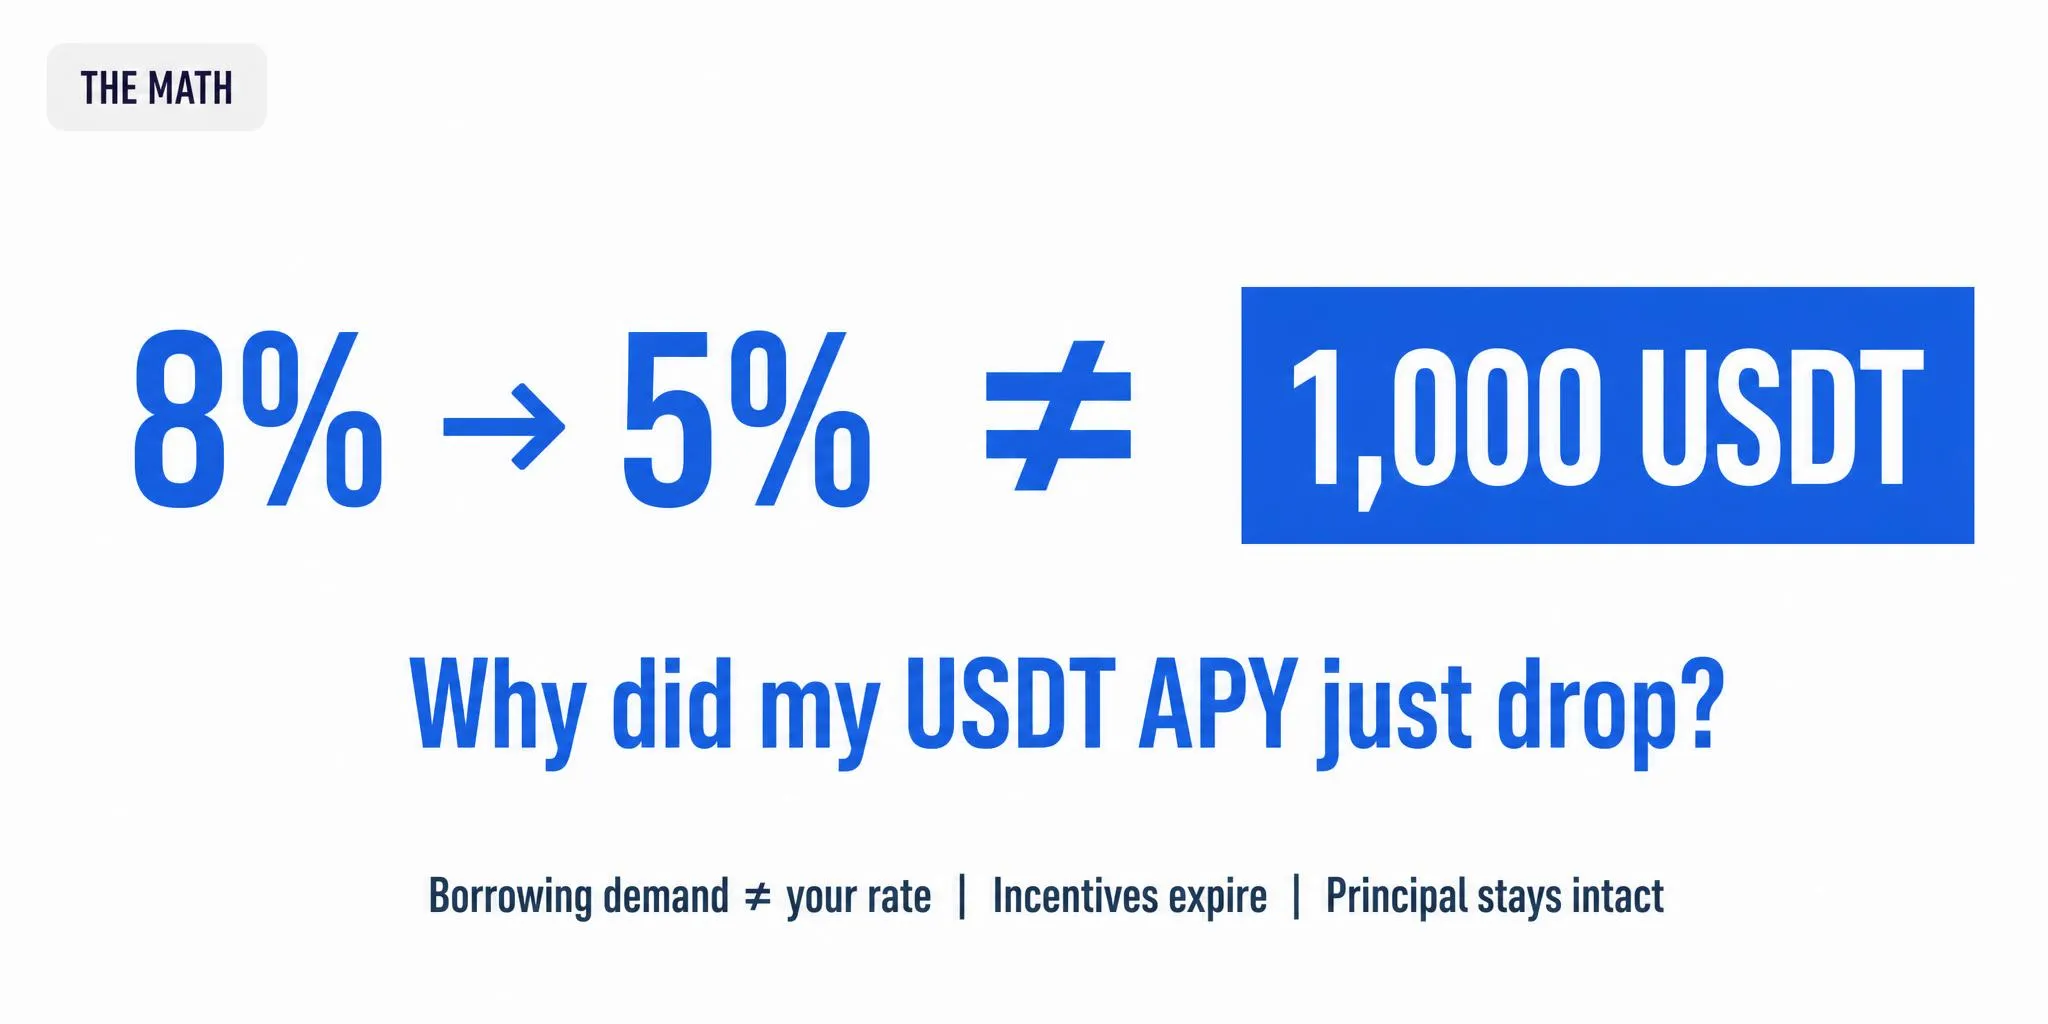
You open the app and see the number has shifted. Again. Last week the APY on your USDT position showed 8%. Today it reads 5%. Nothing else changed — same stablecoin, same deposit. A nagging thought crosses your mind: is the product broken, or was that first rate never real in the first place?
The short answer: the product is probably working exactly as designed. USDT does not generate yield by itself. The number on the screen is an output — a snapshot of a moving economic engine that runs on borrowing demand, market opportunities, incentives and costs. When those inputs change, the output changes. Your principal did not shrink; the pace at which it is expected to grow just moved.
A quick answer before we dig in
Four things to separate right now, because they get tangled up constantly:
- Lower APY is not a loss of principal. If you deposited 1,000 USDT and the displayed annualized rate drops from 8% to 4%, you still hold a claim on your full deposit plus whatever yield has already accrued. The expected growth slowed; the base did not shrink.
- A changing APY is not USDT losing its peg. Tether trading at $0.9998 is a peg question. Your savings rate falling from 6% to 3% is a yield question. They run on separate rails.
- Higher APY does not automatically mean higher risk. Not always. Sometimes it reflects genuinely high borrowing demand. Sometimes it reflects a subsidy that will vanish. The only safe move is to ask why the rate is what it is.
- A variable rate is not a malfunction. If the product explicitly says “variable,” the number is supposed to move. That is the mechanism working, not breaking.
Where the number actually comes from
A displayed yield figure is rarely one single interest rate. Think of it as the sum of several moving parts. One way to picture it:
Displayed yield ≈ underlying market yield + strategy opportunity + incentives − costs
This is not a universal accounting formula. Some products show you a rate that bundles several of these together under one label. Others show you a headline number that includes temporary rewards, and you have to read the fine print to separate the base rate from the promotional layer. The point is: the number is always a composite of things that can change independently.
Let’s walk through the five main reasons a USDT APY moves — the actual mechanisms, not the guesswork.
1. Borrowing demand and utilization
Lending is the oldest source of stablecoin yield. You deposit USDT, someone borrows it, and they pay interest. The rate you receive depends largely on how much of the pool is being borrowed right now, which is called the utilization rate.
When traders want leverage or arbitrageurs spot a gap, they borrow stablecoins aggressively. That pushes utilization up, and the protocol’s algorithm raises the supply rate to attract more deposits and keep the pool balanced. When borrowing demand cools — say, the market turns flat and nobody needs leverage — the pool sits mostly unused. Supply rates fall.
The same logic works in reverse. If a lot of people deposit USDT chasing a rate they saw last week, but borrowing demand hasn’t risen to match, the increased supply dilutes the available yield across more depositors. Same pie, more slices.
On decentralized lending protocols, this relationship is built into the smart contracts. The supply rate responds programmatically to utilization. Aave’s documentation explains this clearly: the interest rate model adjusts borrower interest and depositor earnings based on how much of the supplied capital is being borrowed.
On centralized platforms, the mechanism is similar in economic effect, though the rate-setting process is opaque. Some earn products describe their variable rate as a function of market borrowing demand. OKX’s Simple Earn FAQ, for instance, notes that the variable rate may change because lending demand and market conditions shift.
The practical takeaway: when you see your USDT lending rate fall, check whether borrowing demand in that venue dried up. More often than not, that is the whole story.
2. Market opportunity — funding rates and basis spreads
Some yield mechanisms go beyond simple lending. They take deposited stablecoins and deploy them into market-neutral strategies — positions designed to earn from the difference between spot and futures prices, or from periodic funding payments in perpetual futures markets, without taking directional bets.
These opportunities expand and contract in real time. When the market is euphoric and longs are paying shorts to stay open, funding rates spike and the strategy earns more. When sentiment turns neutral or bearish, those funding payments shrink or even flip. The strategy itself did not change, but the available profit pool did.
Ethena’s documentation on sUSDe rewards spells out this dynamic in detail: yield is calculated based on staking rewards derived from protocol revenue and distributed according to a staking contract, and the displayed rate reflects a weighting between two reward calculation methods over different look-back windows. The number you see is an average of recent outcomes, not a promise about tomorrow.
The practical takeaway: a strategy can remain structurally identical while going from 12% to 3% in a month. No malfunction, no fraud — the spread simply narrowed.
3. Incentives and subsidies
This one catches people off guard.
A product might show a 15% APY when 6% comes from real lending income and 9% comes from the platform distributing its own token to attract liquidity. That 9% is an incentive, not organic yield. When the incentive program ends, so does that portion of the displayed rate.
The rate can drop overnight, and nothing about the underlying mechanism failed. You were just seeing a blend of real economic activity and promotional budget.
How to spot it: if a rate is substantially higher than what lending markets and funding spreads can explain, and there is a governance or platform token involved, at least part of the yield is likely an incentive layer. Incentive-driven yield is not inherently bad — but treating it as permanent is a mistake.
4. Costs and capital allocation
Every yield mechanism has friction. Protocol fees, execution costs, gas on the underlying strategy, slippage on rebalancing trades — all of these chip away at what reaches the depositor.
Then there is a subtler problem: capacity. A strategy might produce an excellent percentage return on the first 10 million USDT it deploys, but when deposits hit 100 million, deploying the extra capital at the same rate becomes difficult. The most profitable opportunities fill up. The yield on the marginal dollar is lower, and since the rate is typically averaged across all depositors, everyone’s displayed APY compresses.
More capital chasing the same opportunity set does not guarantee the same percentage return. That is not a rule anyone imposes — it is the reality of any capacity-constrained strategy.
5. Measurement and distribution
Displayed APY is calculated somehow. That “somehow” matters enormously.
Some products annualize the last day’s return — if yesterday was unusually good, today’s displayed rate will be high, even if the next week will be normal. Others use a 7-day or 30-day trailing average, which smooths things out. A few use a forward-looking estimate. When the calculation window shifts across a spike or a lull, the rate moves.
Then there is when rewards actually arrive. A product that compounds daily and one that distributes weekly can show different numbers even if the underlying economic return is identical. The distribution schedule is a product-design choice, not a reflection of strategy performance.
Treat the displayed APY as a measurement — not as the underlying thing being measured. It is like a weather report, not the weather.
What a rate drop actually means to your money
Let’s walk through a concrete example so the distinction sticks.
Say you deposit 1,000 USDT into a variable-yield product. Over the past month the annualized rate has been humming around 8%. You check again and it shows 4%. What actually happened to your position?
Your principal. It is still the same deposit plus whatever yield accrued during the time you were in. At 8% annualized, a month would have added roughly 6.67 USDT of yield, assuming no compounding complications. At 4% going forward, the next month might add roughly 3.33 USDT. The expected pace of future earnings slowed. Nothing turned your 1,000 USDT into 960 USDT.
Why the drop might have happened. Any of the five reasons above — borrowing demand fell, a funding-rate opportunity closed, an incentive program expired, more deposits diluted the pool, or the product switched from a 1-day to a 7-day calculation window just as a spike dropped out of the sample.
What to consider. One approach to analyzing the change is to ask: “What variable is producing this APY, and what would make it change?” If that cannot be answered in plain language after reading the product’s documentation, the displayed rate may not be very useful information.
Common mistakes when reading USDT yield numbers
- Comparing APYs across products without checking the calculation method. One product compounds daily, another weekly. One shows a 7-day trailing average, another annualizes yesterday. The numbers are not on the same ruler.
- Assuming the current rate will hold. A variable rate is a recent measurement, not a forecast. If the last 30 days were unusually good, the annualized number will look attractive right up until conditions normalize.
- Ignoring the split between base yield and incentives. If half the APY is a platform token subject to its own price volatility, your real-dollar return can diverge sharply from the displayed number.
- Confusing APY with principal safety. The APY tells you something about the pace of earnings. It says nothing about whether the underlying mechanism can lose principal.
- Panicking when a rate drops on a variable-yield product. A drop is often the mechanism behaving as documented, not a red flag.
A way to think about what a rate means
When looking at a USDT yield product, or trying to understand why the rate on a current one just changed, it can help to ask a series of questions rather than stopping at the headline number. Examples include:
- What is producing this yield? Lending, funding-rate capture, liquidity provision, proprietary trading, or something else? If the source is unclear, the number does not mean much.
- What makes it go up or down? Pin the rate to a variable: utilization, spread, incentive budget, capacity, or measurement window.
- What portion is base yield versus incentive? If incentives are large, assume they are temporary and estimate what the rate looks like without them.
- How is the APY calculated? Look-back period and compounding schedule can make two identical economic returns show different numbers.
- What are the exit conditions? Understanding the yield source is step one. Understanding how and when getting back to USDT works — and what could delay that — is step two.
At its core: the APY is an output, not the source of yield. The headline rate reflects a combination of moving variables. The more clearly those variables are documented, the easier it is to interpret the number.
How some products handle this — one approach
The reason stablecoin yield fluctuates is that real economic opportunities fluctuate. A product that tries to smooth that out without hiding it faces a design challenge: capture variable market opportunities while making the experience as straightforward as a savings product.
Some on-chain savings products are built around this idea. The economic yield comes from market-neutral strategies — funding-rate capture, basis trades, stablecoin lending, cross-venue allocation — and an optimization layer handles the allocation, timing and execution so the ordinary holder does not have to. The displayed APY still moves, because the underlying opportunities move. But the system is designed to make the reason for the movement visible: observable reserves, strategy allocations and recent performance data.
[Sponsored content: The following section describes a product from Reinforce.fi, which compensated for this placement.]
Reinforce.fi works in this way. Users deposit USDT into a personal self-custody wallet and receive a yield-bearing on-chain token, USDRL. The strategies that generate the yield are market-neutral in design, but the return is variable — it depends on funding-rate conditions, lending demand and deployment capacity, exactly as this article describes. The product aims to expose proof-oriented data so you can see supply, backing and strategy allocation rather than relying solely on a displayed rate. This model comes with its own trade-offs: smart-contract risk, peg and redemption risk, liquidity constraints and settlement timing. The difference is not that it is “safer” — it is that the mechanism and the data are designed to be inspected.
If that approach matches your need — a model whose yield source, liquidity conditions and main risks can be explained in plain language — it is worth reading the documentation and comparing it against alternatives using the types of questions outlined above.
Frequently asked questions
Can USDT yield drop to zero?
Yes, it can. If the yield is generated by lending, and borrowing demand evaporates entirely while the pool is full, the supply rate can approach zero. If it is generated by funding-rate strategies, and the basis flattens or inverts for an extended period, the strategy may earn nothing or even incur small costs. A yield near zero does not mean the product failed — it means the economic opportunity that powers it is currently absent. The principal is a separate question.
Is USDT lending yield sustainable?
It is sustainable to the extent that borrowers continue to pay for access to USDT liquidity. Lending demand has structural drivers — leverage, arbitrage, working capital — that do not disappear in every market condition, but they do fluctuate. Yield can remain positive over long periods without being steady. A 3% average over a year might include months of 8% and months of 0.5%. That is the nature of variable-rate markets.
What makes stablecoin yield go up and down?
Five main variables, as detailed above: borrowing demand and pool utilization; the size of funding-rate and basis-spread opportunities; the presence or expiry of incentive programs; costs and how much capital can be deployed at a given rate; and how the platform measures and distributes the displayed yield. Usually more than one of these is moving at the same time.
Why did my USDT earn rate suddenly decrease?
The most common causes, in rough order: an incentive or promotional period ended; borrowing demand dropped, especially on lending products; the trailing calculation window dropped a high-earning day and replaced it with an average one; or more deposits entered the pool and diluted the rate without a matching increase in borrowing or strategy capacity.
Does a lower APY mean I am losing money?
No. A lower APY means the pace of expected future earnings decreased. Your deposited principal is not reduced by a rate change on a variable-yield product, provided the product is functioning normally.
How do stablecoins make a profit for the platform or protocol?
Lending protocols take a small cut of the interest spread between what borrowers pay and what depositors receive. Strategy-based products may charge a management or performance fee on the yield generated. Centralized platforms combine several revenue sources. The yield you see is typically net of those fees.
Next step: before comparing USDT yield products, pick the one you are currently looking at and see if you can answer the five questions from the framework above using only the product’s own documentation. If you cannot answer those questions yet, continue to gather information from reliable sources.
For a deeper look at how APY differs from APR and why the calculation method matters, see our dedicated APR vs APY explainer. If you want a broader overview of the different ways to put USDT to work, read how to earn interest on USDT.
Disclaimer
This article is for informational purposes only and is not financial, investment, legal, or tax advice. Crypto products, stablecoins, on-chain protocols, and yield-bearing tokens involve risk, including possible loss of funds. USDRL is designed to be USDT-pegged and yield-bearing, but peg stability, yield, liquidity, and redemption are not guaranteed. Always do your own research, understand the risks, and never deposit more than you can afford to lose.